Getting Started with Matlab
Matlab is a contraction for “Matrix Laboratory.” Matlab is programming language and environment for scientific computing that is centered on matrices. It is quick for doing simple things, and incredibly extensible for doing more involved things. However if you haven’t been exposed to this kind of environment before, it may seem very foreign to you. Don’t let the word “programming” scare you. It is just a tool to get work done. If there is one application you should know as a geologist, this is it.
The Desktop
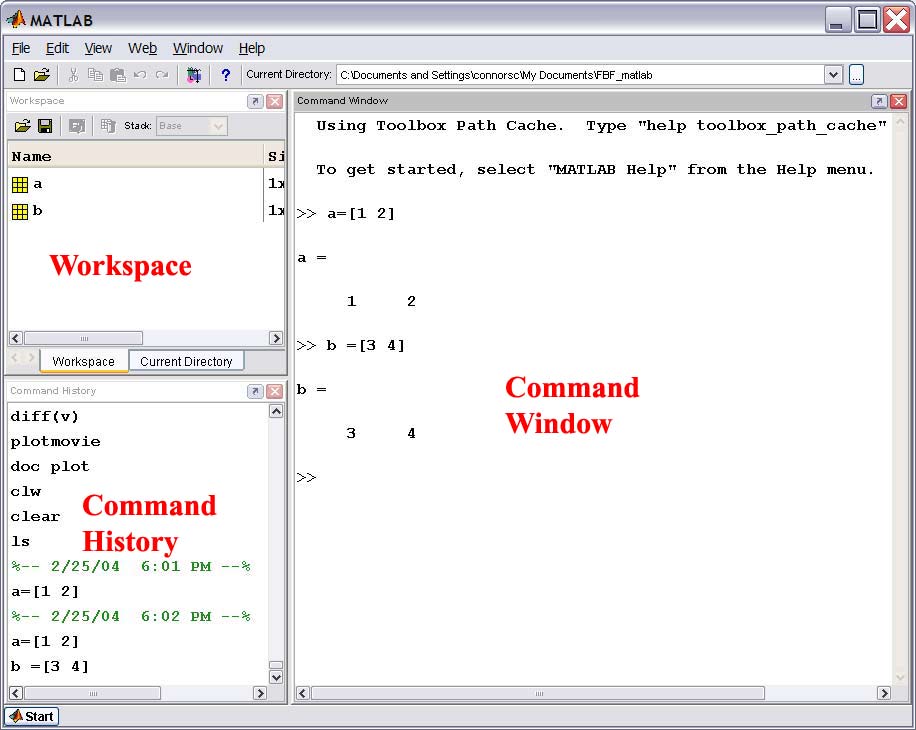
When you start Matlab you will see the desktop which by default is composed of the Command Window, Command History and Workspace.

The Command Window
Often times you will work at the command line in the command window. The command window allows you to type commands directly and see the results immediately. For example at the >>, define a variable "a" by typing
>> a=[1 2]
What is printed out below is the output of the command
a =
1 2
The Editor Window
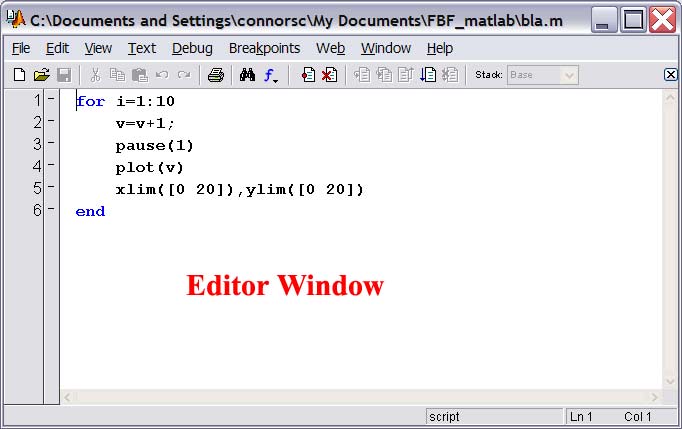
Alternatively you can write a program or script called a m-file (has a .m extension) in the Editor Window. The Editor Window is a word processor specifically designed for Matlab commands so it automatically formats certain things for you such as the command "for" below

This program may consist of one or many commands to execute. Once the program is saved you can just type the name of the file and all of the commands will execute. It is common to try a series of commands at the command line and once you like them, copy them from the Command History and then paste them into a m-file. If you want to make comments that help explain in English what different code does you put a "%" symbol in front of the text.
Getting Help
Matlab has an incredibly good help system. The help is built into Matlab and can be accessed from the help menu, but the full help is available online at mathworks.com. Because this help is so good, it is silly to reproduce everything here. We show some brief descriptions on commands below, but we expect you to READ THE HELP FILES.
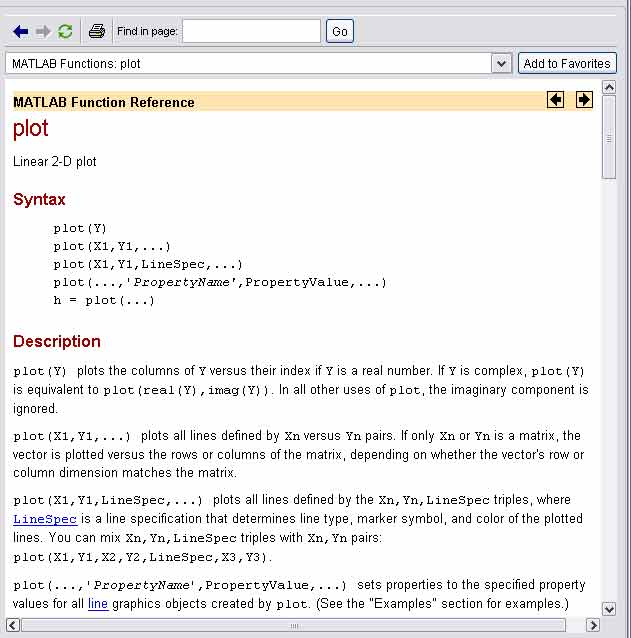
To get help on a command, type "doc commandname" in Command Window where commandname is the command of interest. For example:
>> doc plot
gives

Some basic things
Data structure
In Excel everything is a cell, in Matlab everything is a matrix. This is different, but good. Often you don’t need to or want to see the matrix, just think of them as variables like “X”
Key point: Matlab works on the whole array of a matrix
For example:
>> alpha = [0 pi/4 pi/2]alpha =
0 0.7854 1.5708
>> sin(alpha)
ans =
0 0.7071 1.0000
Basic Linear Algebra
Key point: It is important to understand the difference between an operator that operates on each element in an array and one that operators on the whole array.
For example :
>> a=[1 2 3]
a =
1 2 3
>> a*a
??? Error using ==> mtimes
Inner matrix dimensions must agree.
>>
This occurs because the '*' operator is trying to do a type of vector multiplication called the dot product
If you want to multiply each entry in a then you should try:
>> a.*a
ans =
1 4 9
But Matlab is smart enough to multiply a vector by a scalar so you can do:
>> a*3
ans =
3 6 9
Manipulating Matrices
Elements in arrays are addressed by their rows and columns numbers, using a semicolon to extend a range. For example:
>> a = [ 1 4 7; 2 8 5] %build a matrix
a =
1 4 7
2 8 5
>> a(2,3) %reference the elements in the second row, third column
ans =
5
>> a(:,2) %reference all the elements in the second column
ans =
4
8
>> a(1:2,2:3) %reference the elements in the first and second rows and second and third columns
ans =
4 7
8 5
Basic Plotting
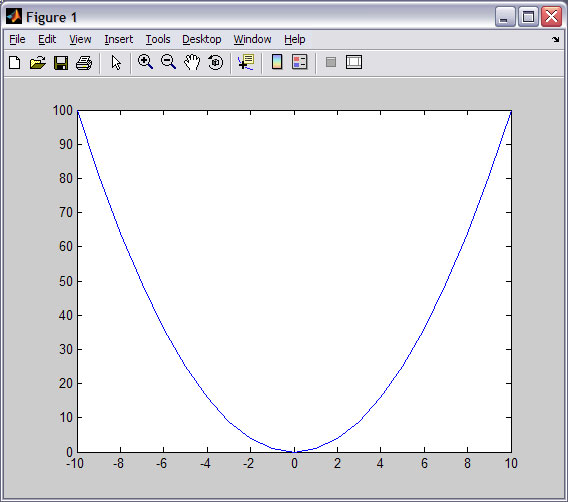
You can either right-click a variable in the workspace and choose plot (sometimes works if your data structure is the form that Matlab expects), or you can use the plot command. Key thing to look out for: We often want a proportional plot so be sure to type “axis equal” after you plot something to get 1 increment of x to equal 1 increment of y.
>> x=-10:10
x =
Columns 1 through 20
-10 -9 -8 -7 -6 -5 -4 -3 -2 -1 0 1 2 3 4 5 6 7 8 9
Column 21
10
>> y=x.^2
y =
Columns 1 through 20
100 81 64 49 36 25 16 9 4 1 0 1 4 9 16 25 36 49 64 81
Column 21
100
>> plot(x,y)

Repeating commands
You can always retrieve previous commands you have executed by pressing the up arrow or by typing the first letter of the command and then pressing up arrow.
You can save any command by copying it from the command window and pasting it into an editor window. Saving this as a m-file allows you to repeat the command anytime you type the name of the file in your command window.
C. Connors, 2003, modified '07