Using the GlobalMapper GIS program
If want more details on how to use Global Mapper see my Global Mapper FAQ. There are some videos there, so if you learn better that way, wathc the first two, but you can also just follow the steps below to finish the assignment. On some other assignments in this class, you will be using GlobalMapper to analyize some particular aspect of geology. The help for it is very good and I encourage you to go to the help menu. Having said that, GlobalMapper is a pretty involved program, so here are the specifics of the steps for getting your GPS survey data into the program and produce a map.
The data for your Map GPS GIS lab is located in R:\courses\GEOL_102-02_Winter_2023\Map Exercise. Do not double click any of these files because the associated extension is not GlobalMapper.
After doing a couple of these steps you probably want to save the work you have done. Go to File Menu > Save Workspace. Note, you have to save this, and all other files to some place you can get to later. So I suggest using Box Drive. Here is a how-to from ITS. If you try and save any files to a workstation in the Geo or IQ Center computer labs the files will likely be lost when you log out because these machines do save files between reboots. That is one of the reasons for the servers and Box Drive.
1) Open up GlobalMapper from a Geo Comp Lab or IQ Center Lab workstation.
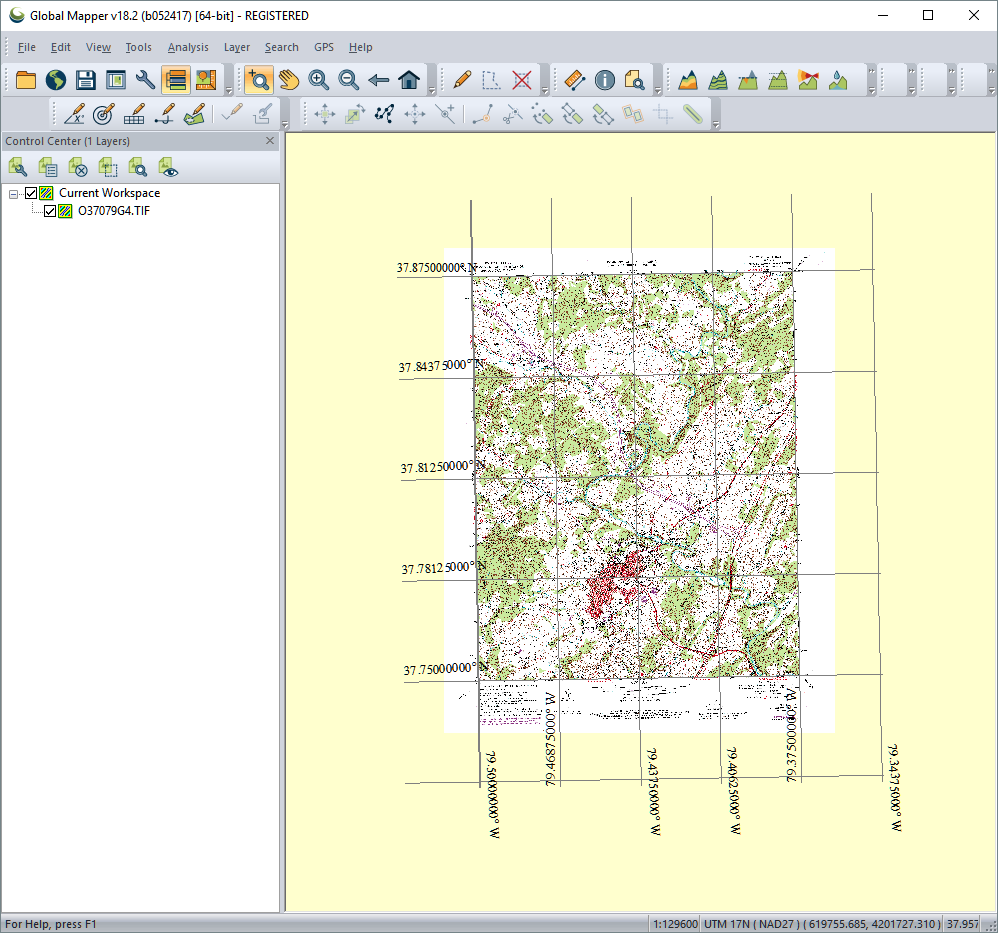
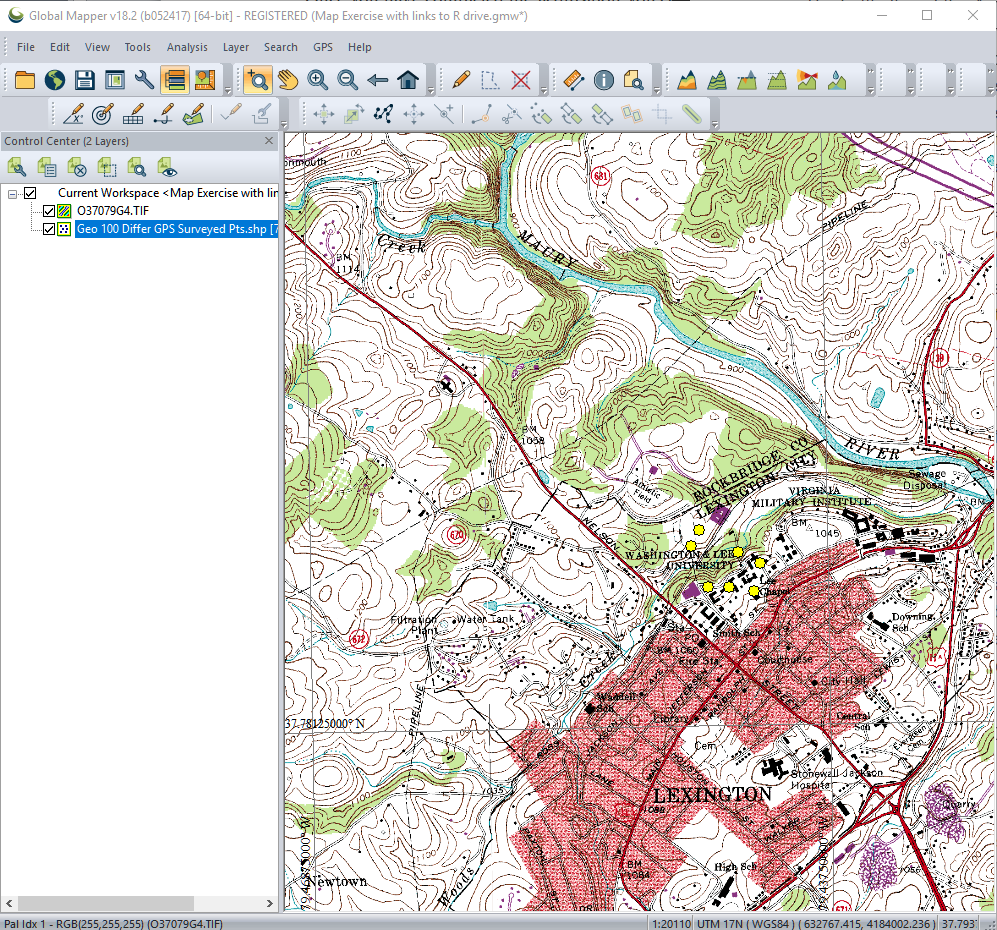
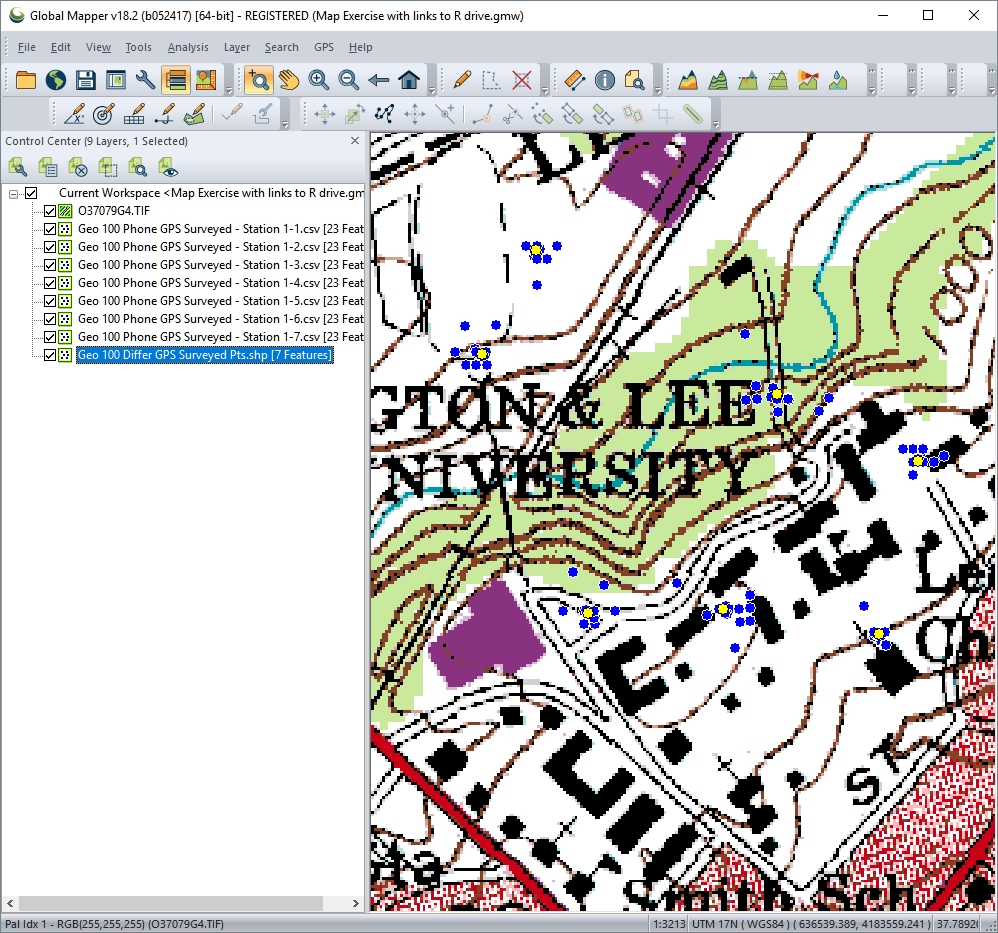
2) Load the DRG topo map of Lexington. DRG stands for Digital Raster Graphic. It is a scanned version of a USGS topographic map. You load a file by going to the File Menu -> Open Data File(s) or drag the file icon over the open GlobalMapper program. The file you want is in the folder "Lexington_nad27_DRG" and the file itself is entitled "O37079G4.TIF" You should see something like the window below. Note that on the left the Control Center shows an explorer-like view of the layers in the project. You can hide any layer by uncheking its box. This Control Panel can be hidden or viewed by going to the Tools Menu -> or by clicking the 6th icon from the left (looks like 3 colored rectangles). Save the project now.
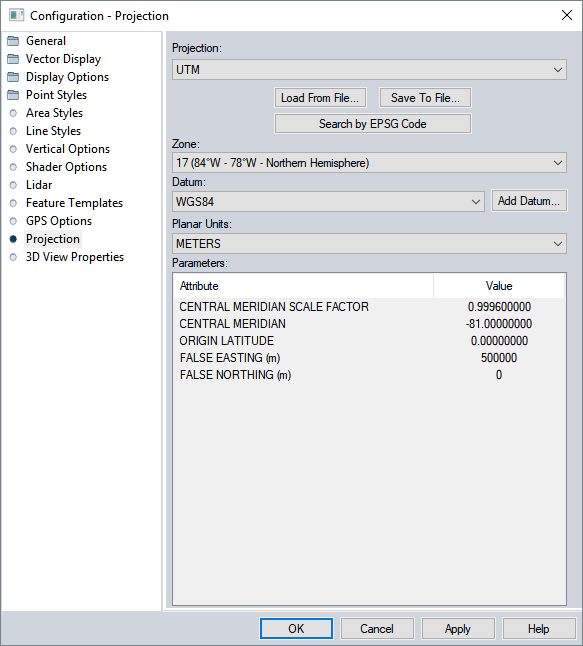
3) Change the datum to WGS84. Note that when you open a file that has georeferencing information (projection, datum, etc) that this information is automatically populated. To change that information go to the Tools Menu -> Configure or by clicking the 5th icon from the left (looks like a wrench). Click the Projection item on the left. Change the Datum to WGS84.
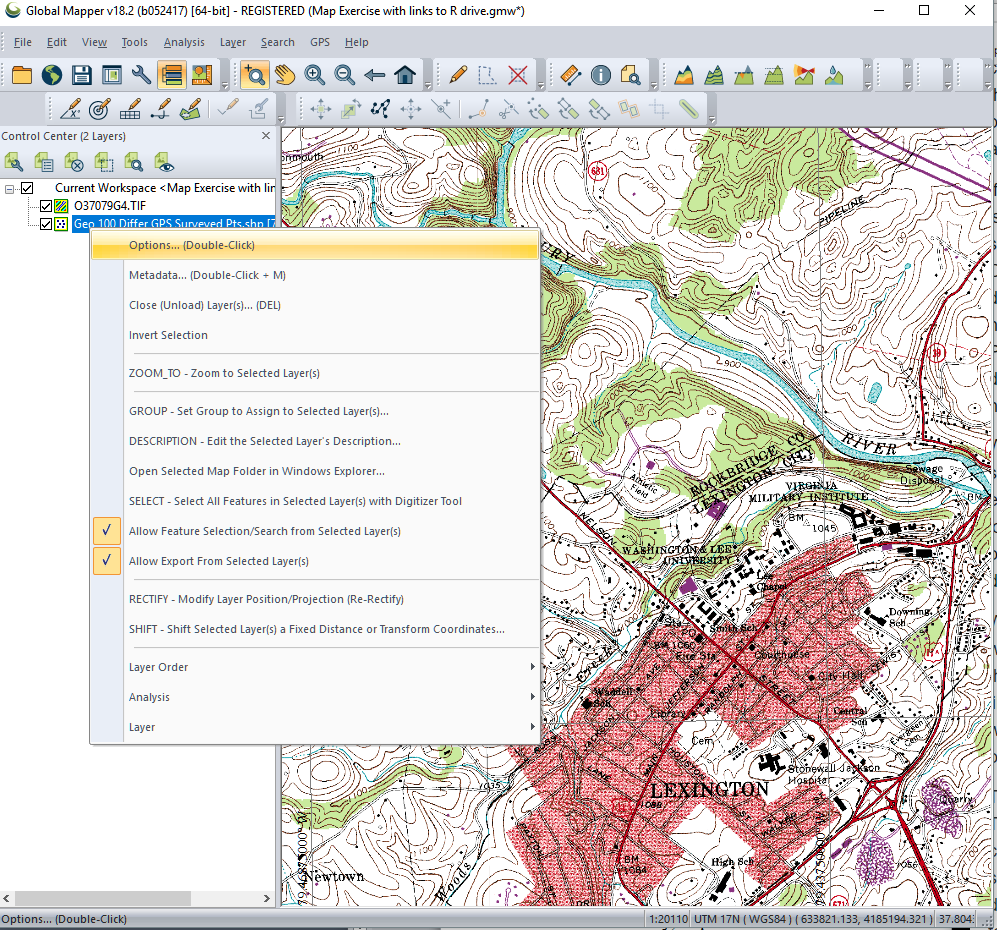
4) Load the Differential GPS points I surveyed. Drag the file "Geo 100 Differ GPS Surveyed Pts.shp" into GlobalMapper. Note, these show up in the Control Center on the left. Zoom into the points by clicking the Zoom tool (7th icon from the left). Right click the Differential GPS points layer and select Options.
Now click the Point Styles tab at the top. Click the Use Same Style for All Features radio button. And change the symbol to Dot - Yellow with a Scale Factor of 2.
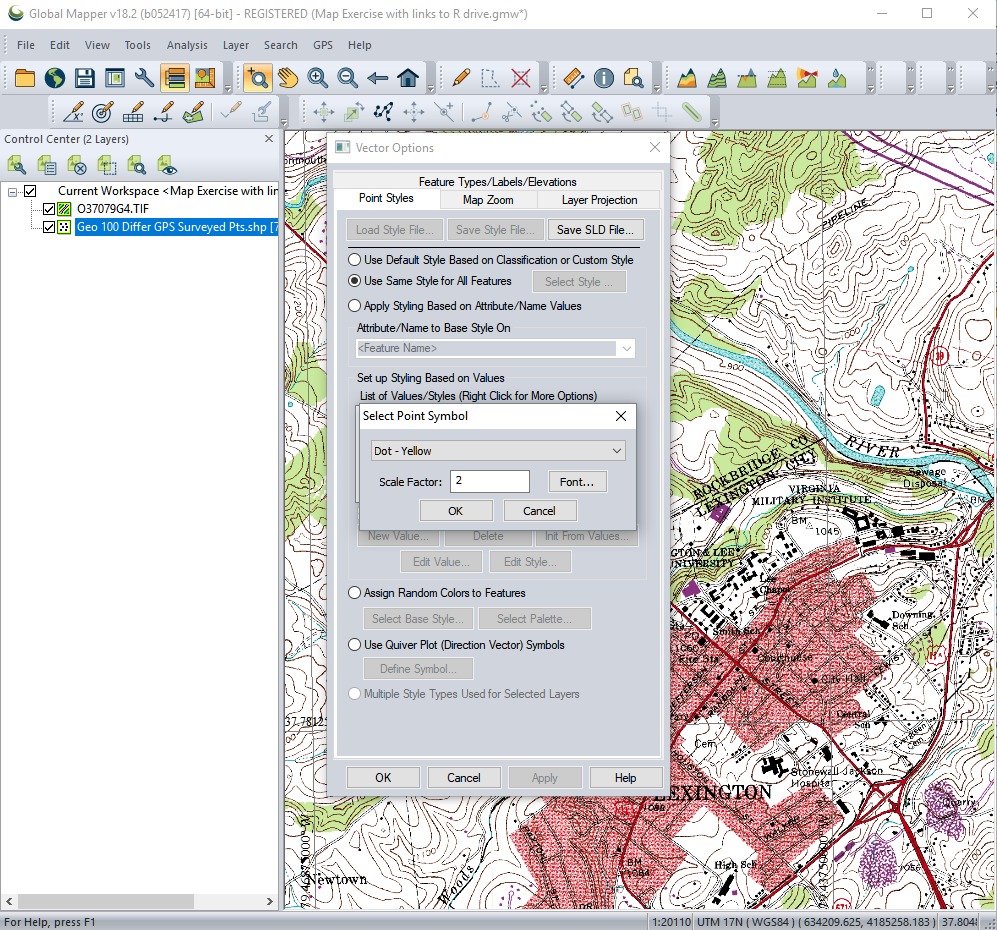
Click OK. Then OK again on the next dialog box. You should see the Stations as yellow dots.
5) Export from Google sheets all seven phone-surveyed station sheets as .csv files. A .csv is a "comma separated" text file. You can look at them in Notepad, but we really want to load these into GlobalMapper.
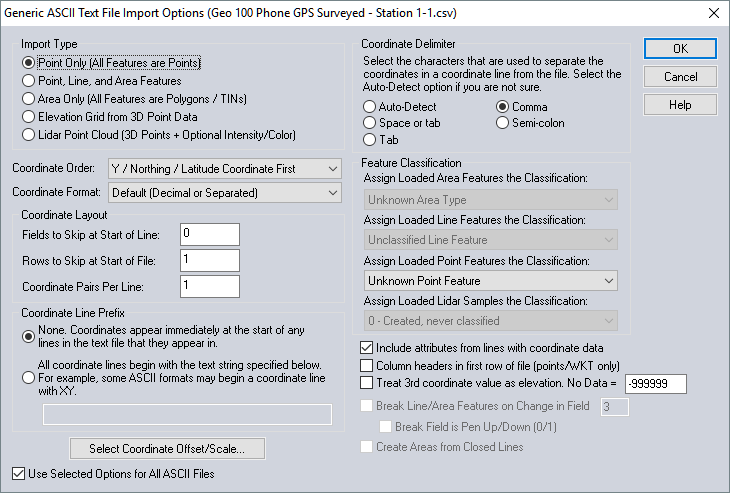
6) Import each sheet into GlobalMapper. Drag each .csv file into GlobalMapper. You will be prompted with a dialog box entitled Generic ASCII Text File Imports Options. Use Import Type Points. From the Google sheet you will recall that that data was Latitude then Longitude so make the Coordinate Order set to Latitude Coordinate First. Also remember fromt the file there was a row that defined each column so set Rows to Skip at Start of File to 1. Finally uncheck the box that says Treat 3rd coordinate value as elevation. And click OK.
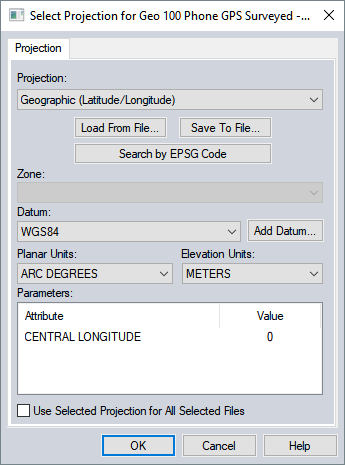
This will prompt you with a dialog box to select the "projection." Change the projection to Geographic (Latitude/Longitude). Make sure the Datum is WGS84.
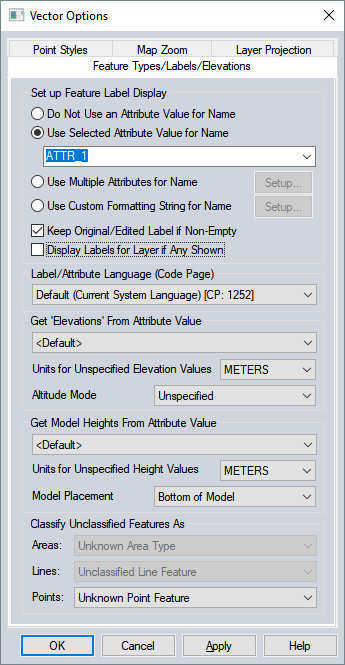
Selection all of the phone files in the Control Center and right click to remove the labeling of the points by unclicking the box entitled Display Labels for Layer if Any Shown. Click OK.
7) Display the data in a way that allows you to see a difference between the phone-surveyed and Differential GPS points. Do this by right-clicking each layer and changing the Point Styles like you did for the Differential GPS points in the step above. Zoom in so you can see the data better. You might find that you leave off an outlier in order to see the rest of the data better. Layers are displayed from the top to the bottom in the Control Center. So you might also want to click and drag the Differential GPS Points layer to the bottom to see them better.
8) In Excel calculate the Mean and Median of each of the 7 Stations. Export as CVS files and then import into GlobalMapper. Make the phone mean a Red Dot size 2, and the phone median a Green Dot size 2.
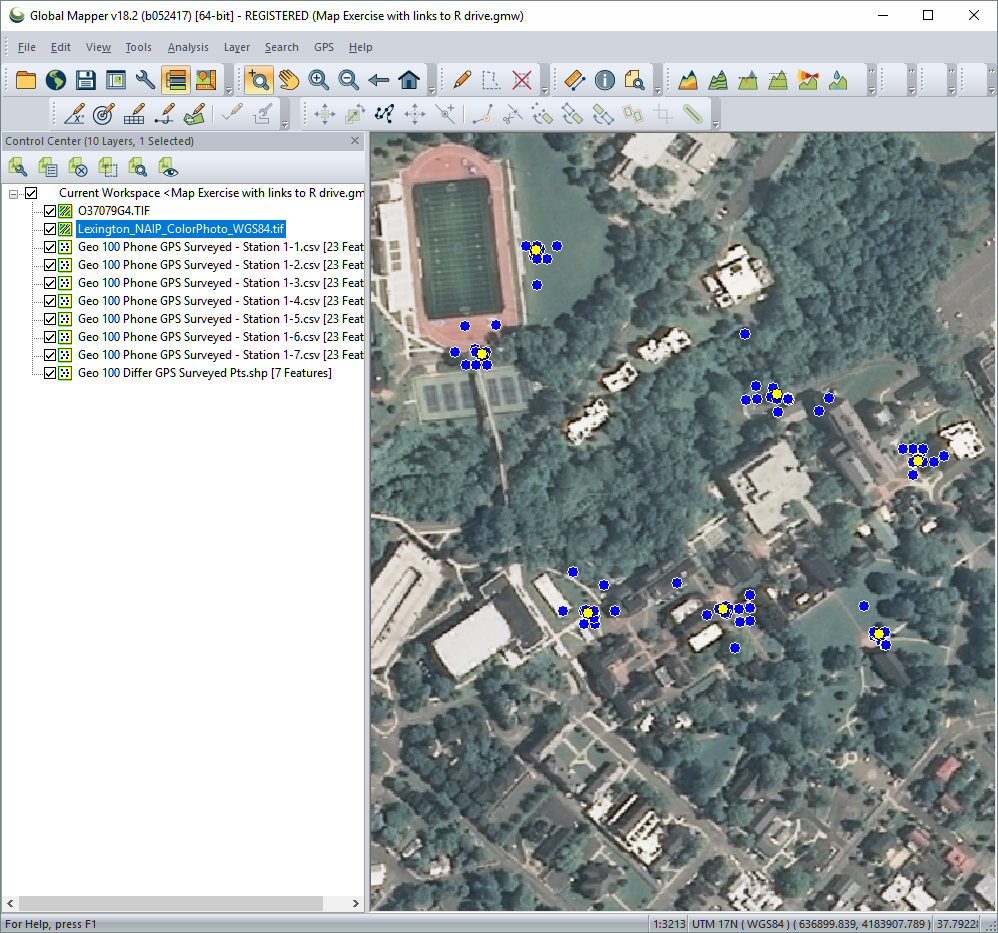
9) Load the NAIP airphoto and look at how the points sit relative to features in the air photos. The file you want is located in the folder "Lexington_NAIP_ColorPhoto_WGS84" and the file itself is entitled "Lexington_NAIP_ColorPhoto_WGS84.tif" You will defintely want to drag this NAIP layer above the surveyed points layers in the Control Center.
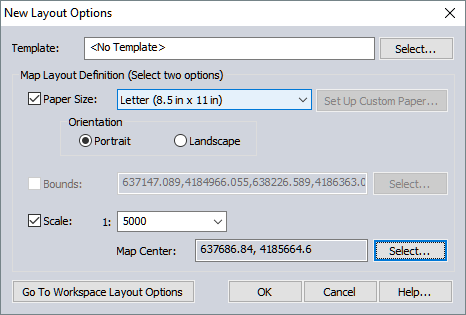
10) Make a printable map with a proper scale, grid lines, etc. Go to the Tools Menu -> Map Layout Editor or click the 4th icon from the left (looks liek a mini dialog box). Use page size letter portrait, and choose a scale that works to show the data. Note, make sure to define the Map Center by clicking the Select button.
To add a scale and north arrow use the Insert Menu at the top of the Map Layout Editor that comes up. You can also have it automatically put in the projection and datum info by going to Menu -> Insert Text Element and then choosing the Select Macro button. To get the grid click the 8th element from the left entitled Map Element Control Center and choose the Properties button of the Map Element and then the Grid Frame tab. Note, that the automatic setting may not show any grid coordinates so choose Custom and play with the numbers.
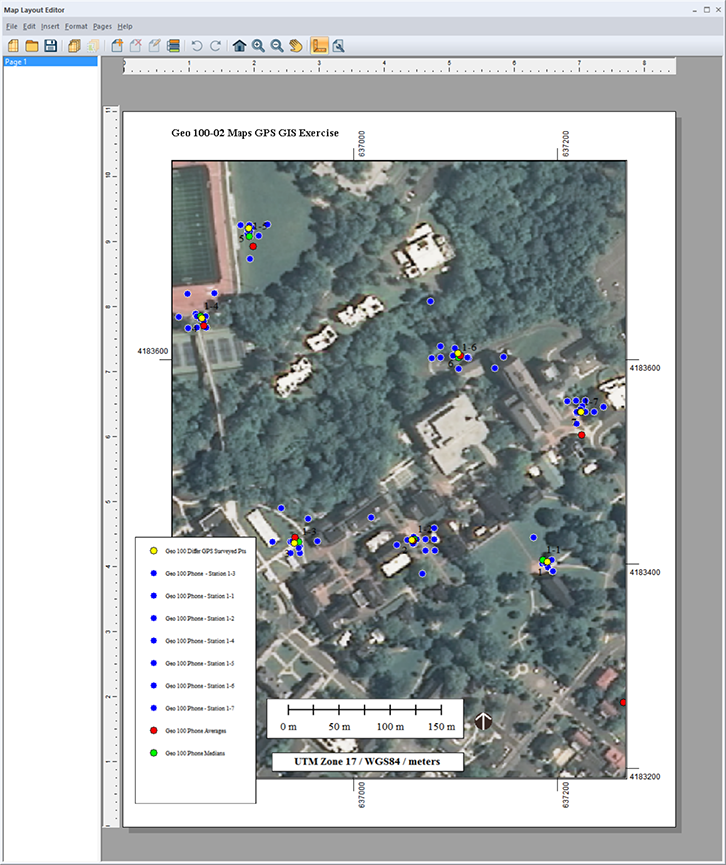
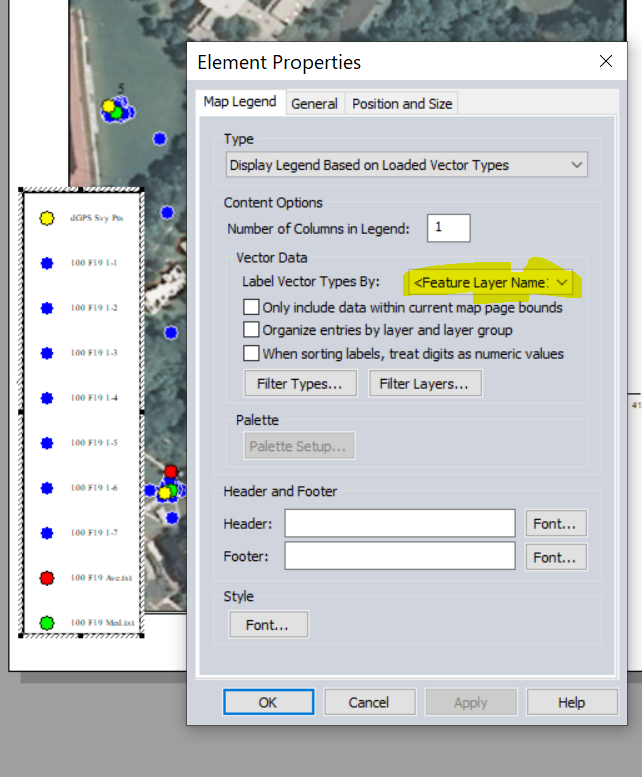
To change what the legend text shows, right click the legend and choose properties. Then choose Label Vector Types By: Feature Layer Name, and uncheck the other boxes (see the figure below).
This will name the entries in the same way as you have the Layers named in your Control Center. If you want the Legend to have different text, you edit the Layer names in the main GlobalMapper window and this changes them in the legend. You do this by clicking on a layer (not the legend) and it hightlights then you can change it.
You might want to zoom in even more? You decide what is best for what you are trying to explain in your paragraph narrative. Note, in your narrative don't forget to indicate what the different colored dots represent referring to your legend.
Create a pdf, saved on your Box Drive. Then print the pdf on a color printer. There is a color printer adjacent to the geo lab, or find one elsewhere. Make sure to click the button Actual Size in the print dialog box. Otherwise the printed map would be fit to page and not the correct scale, another lesson about going between digital and real-world maps. Why the extra step of making a pdf? Because once you have made the pdf, you do not need to go back into Global Mapper. Besides having digital copies is always useful.