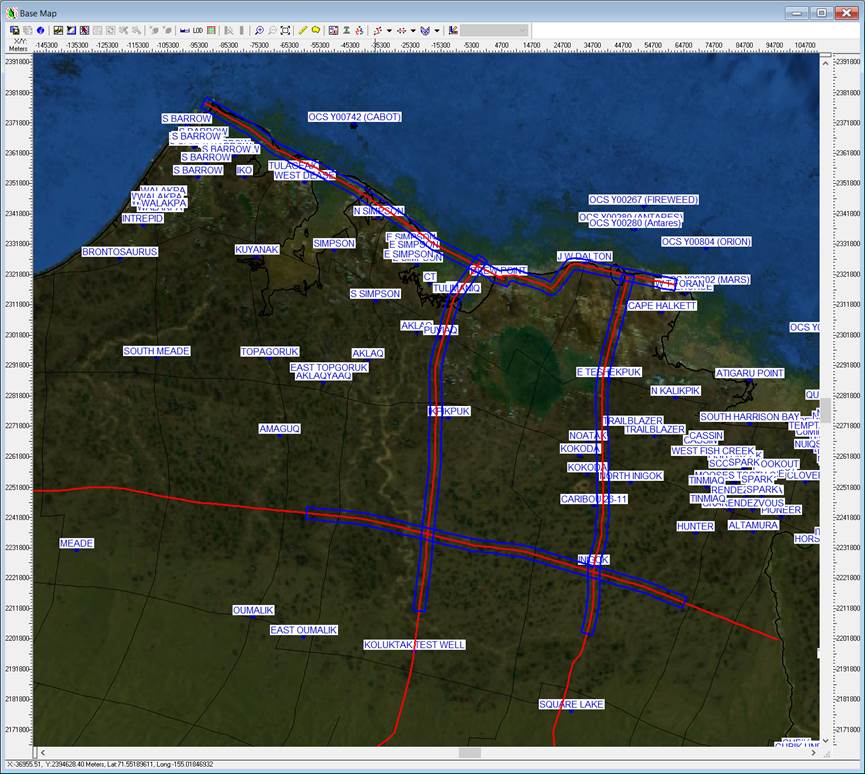
Your task is to do a regional seismic interpretation of parts of four lines of time-migrated regional seismic from the North Slope in the National Petroleum Reserve of Alaska (NPRA). The segments of the lines you are responsible for are highlighted in blue in the attached figure. You are to work alone on this, and turn in your own presentation, but you can talk with others as you wish. You are not to copy any other person’s work directly. Nor are you to look at their project, without their explicit permission. You should pledge all work.
Project is Due Wed. Oct. 15.
The data and reports you are given are as follows:
1. The existing Kingdom project. The original is of course in the class folder on R called SMT_NorthSlope – Seismic Exercise, but it is best to use your existing project that you have correlated the logs, and tie to those corelated formation tops.
2. Additional formation tops I give below (add these to your tops in your Author in your Kingdom Project).
3. Two time-depth functions for the Ikpikpuk and East Teshekpuk wells.
3. Other material from the well-log correlation exercise, such as the MMS report and USGS strat col, and most importantly the Bird paper.
You should not need to use any other sources on the geology in the area in order to complete the assignment, but you can if you like. I would discourage this, as the reason for the assignment is for you to learn how to do regional seismic interpretation and not regurgitate stuff from a literature search. Your existing tops from your well-log interpretation and the existing MMS report, Bird paper, and USGS fact sheet should be enough to get you going, as well as the additional tops and T-D functions. If you do choose to use any other sources, such as published articles or the internet, you must cite clearly what you used. Regardless, you should cite the MMS report, the Bird paper and the USGS fact sheet, as you are to use these. You are absolutely not to use any other Kingdom projects, either research, current, or former class projects, or look at another former class presentations. This absolutely falls under the honor code.
The seismic that you are to interpret:
Lines R-7, R-8, R11, R-14. Feel free to look at the other R lines in the survey, but the deliverable is only on these lines.
Your seismic interpretation should include the following labeled horizons with colors indicated:
Nanushuk Group and Torok Fm. (as one integrated set of multiple sequence boundaries of different colors), Pebble Shale Unit (red), Kingak Shale (green), Shublik Fm. (pink), Lisburne Group (light blue), Endicott Group (dark blue), Basement brown). If you need an additional unconformity to explain things use red.
You should tie to all the wells as best you can. In particular for the Lisburne, Endicott, and Basement you should tie to the Inigok-1, Ikpikpuk and East Teshekpuk wells where you have formation tops and these are close to the seismic. There is a loaded time-depth (T-D) function for the Inigok-1 well. See the T-D function for the other wells below.
The Nanushuk and Torok have characteristic clinoforms and these lithofacies are to be mapped together. Thus, the formations defined by lithology in well tops do not really correspond to any distinct seismic horizon---sequence stratigraphy is real! For these you will need to have multiple horizons (sequences) with the same color, or slightly different shades, so that the full formation/group is still clear when displayed. Plan on at least 4 of these to capture the essence of these clinoforms. For these horizons you should map sequence boundaries as best you can. It might be helpful to look at crossing lines to see if the events you are following are continuous, but you only need to turn in an interpretation on the four lines. You will want to vertically exaggerate the line in order to interpret the stratigraphy.
Note, that in addition to the unconformities of the sequences, there are potentially other significant unconformities. Be mindful of a seismic event truncating at another event. You will want to vertically exaggerate the line in order to interpret these unconformities.
You likewise might encounter faults. Interpret these as lines or polylines that break or offset the horizons. Use black to indicate these. There are structures on this line, in particular fault-related folds. Don’t sweat this too much and interpret as best you can. At the very least try and follow the horizons across folds, and if you think there is a fault interpret it by digitizing the plane of the fault that breaks the horizons across the fault. You will want to NOT vertically exaggerate the line in order to interpret the structure. That is, try to be 1:1 for this part. Assume an average velocity of 3600 m/s.
Basement is not picked in all the wells, but you should interpret this horizon as a nonconformity separating metamorphic or igneous rock, devoid of reflectors from the stratigraphic section above, usually a strong peak. It often is irregular with diffractions or scattered data emanating from it.
You should start your interpretation with the basement, then move up the section to Endicott, Lisburne, etc.
Below is some general advice to get you started.
Start by setting up your seismic display to show things clearly using either black-white, or Landmark color bars. You might need to change the histogram stretch of the amplitudes. Determine your vertical exaggeration and play with changing it. Note, you should mostly pick manually, but you can try to autopick. Refer to the guide on interpreting seismic that I handed out, but a quick summary of it is to turn on the tops and display them on the seismic. A continuous seismic event very close to the top is what you will want to follow. You can display the gamma ray in the wells if you are curious to see tie to the seismic. There are plenty of artifacts in these vintage, 2-D land data, so you should be very mindful of the artifacts we talked about in class. Figuring out what is real and what is not, is what distinguishes the best interpreters.
The deliverables are:
An interpreted SMT project of the horizons mapped in the area (just tell me where it is on the server).
2. A PowerPoint presentation that explains, summarizes, synthesizes the stratigraphy, structures, and structural timing based on your interpretation of the horizons in the seismic. Note, you should discuss how this relates to what you concluded about the regional highs and lows and regional timing from your log correlation. That is, this should be a clarification and expansion of that discussion. With these seismic you should be able to much better explain why certain wells did or did not penetrate the formations you picked before. You do not need to pick any of the formation tops, but you could discuss if certain wells picks you made might need reevaluation.
Follow the guide to technical reports. You can certainly start with your existing log interpretation PowerPoint, but you should basically only be using the intro/regional/strat slides. Consider this a chance to make any changes to improve the basics/background of the previous presentation. You might include a map from the previous log presentation. You should NOT include all of the slides from your log-correlation presentation. The reason for this would be to refer to what you learned from the seismic interpretation that either differs, or supports the previous log interpretation. You do NOT need to change your conclusions from your log correlation, but rather can say something like regional seismic was interpreted that clarifies the interpretations from the logs. For the whole presentation try and relate your seismic interpretation to what is known about the area from the Bird paper.
Use a 16:9 ratio for the PowerPoint size to accentuate the long nature of the lines. In the presentation one thing you must be very mindful of is that your seismic images you show are of high enough resolution that one can see the structure and stratigraphy of the data underlying your interpretation. So, you probably will have to show more than one scale enlarging certain parts to show the interpretation and data better. You should label the horizons clearly. You should make sure to display the wells with labeled formation tops too. This serves as your tie to the seismic and will mesh well with your log correlation presentation. You could also show gamma ray logs if you want, but this is not required and might be too busy.
Additional Formation Tops (add these to your tops in your Kingdom Project):
Well |
Lisburne top (ft MD) |
Endicott Top (ft MD) |
Inigok |
13850 |
17870 |
Ikpikpuk |
11390 |
14550 |
E. Tesh |
9650 |
Not penetrated |
Time-Depth functions for additional wells
Ikpikpuk Test Well No. 1 |
||
Depth below K.B. |
GEO tgd |
TWTT |
250 |
0.0248 |
0.0496 |
500 |
0.0592 |
0.1184 |
750 |
0.0916 |
0.1832 |
1000 |
0.1252 |
0.2504 |
1250 |
0.1571 |
0.3142 |
1500 |
0.1888 |
0.3776 |
2000 |
0.2476 |
0.4952 |
2880 |
0.3425 |
0.685 |
3750 |
0.4346 |
0.8692 |
5262 |
0.5742 |
1.1484 |
6702 |
0.6949 |
1.3898 |
7235 |
0.7369 |
1.4738 |
7440 |
0.7591 |
1.5182 |
9040 |
0.9023 |
1.8046 |
9630 |
0.9524 |
1.9048 |
9845 |
0.9702 |
1.9404 |
10378 |
1.0054 |
2.0108 |
10440 |
1.0153 |
2.0306 |
11096 |
1.0525 |
2.105 |
11290 |
1.0673 |
2.1346 |
11420 |
1.0754 |
2.1508 |
14185 |
1.2216 |
2.4432 |
14496 |
1.2411 |
2.4822 |
14800 |
1.252 |
2.504 |
15320 |
1.2811 |
2.5622 |
15405 |
1.2871 |
2.5742 |
EAST TESHEKPUK NO. 1 |
||
Depth below K.B. |
two-way time |
GEO tgd |
3072 |
0.7954 |
0.3977 |
6572 |
1.4858 |
0.7429 |
7572 |
1.6632 |
0.8316 |
8072 |
1.7556 |
0.8778 |
8572 |
1.8442 |
0.9221 |
9072 |
1.9148 |
0.9574 |
9572 |
1.9846 |
0.9923 |
10572 |
2.0964 |
1.0482 |
Line segments you are to interpret are shown in blue. They are part of the longer, full lines which are shown in red.